
推奨事項: 3つの対照的なサムネイルレイアウトを固定した動画セットでA/Bテストを行い、クリック率のシグナルを自動収集して最適な構造を明らかにし、その結果をスケーラブルな戦略に合わせることから始めましょう。
共有戦略を使用し、迅速なイテレーションを優先します。スペース、タイポグラフィ、レイアウトを一定に保つことで視覚的な変数を分離します。コントラスト、画像、明確な測定ウィンドウを割り当てて、複数の動画にわたるクリック率への影響を捉えます。このアプローチは、ワークフローを簡素化し、証拠基盤を強化するのに役立ちます。
実践的な目標: 各レイアウトバリアントを7〜14日間実行します。オプションごとに少なくとも50,000回のインプレッションを蓄積します。ベースラインを5%以上上回るクリック率を目標とします。同時に、完了率を監視します。平均視聴時間を追跡します。
自動化されたスコアリングは、コンピューター支援のルーブリックを使用してサムネイルオプションを比較します。テンプレートは、自動バッチ評価をサポートします。対照的なレイアウトは、好奇心、可読性、ブランド認知への影響を考慮した単一のスコアに貢献します。推測をデータに置き換えることで、測定に革命をもたらします。
レイアウト全体で一貫した表現を維持すると、顔の周りのスペースが確保され、ノイズが減り、視聴者にとっての重要性が高まります。これは、一貫したカラー スキーム、明確なタイポグラフィ、規律あるフレーミング ポリシーを意味します。この組み合わせ効果は、初期のインパクトを強化し、長期的なエンゲージメントを維持するのに役立ちます。チームが制作サイクルを簡素化するための実用的な手段です。
YouTubeでのCTR向上に向けた実用的なサムネイル戦略
コアとなる動きから始めましょう。単一の高コントラストのカバー画像。クリーンなサンセリフ体で2〜3語の太字の説明。 clutter-freeな背景。メインの被写体がフレームの60〜70%を占めます。モバイルでも可読性は高く保たれます。この構成は推測ではありません。数十人のクリエイターからのデータがクロスプラットフォームでの勝利を示しています。パフォーマンスメトリクスは機能します。
3つのコア要素に焦点を当てた一貫したビジュアルシステムを確立します。主要な被写体、テキストオーバーレイによるトピックの簡潔な表現、鮮やかですが限定的なパレット。ピクセル単位の配置が重要です。この一貫性は認識にとって重要です。データが蓄積されるにつれて予測が改善されます。3つのコア要素に焦点を当てたアプローチは、さまざまなトピックにわたって機能します。このセットアップは、新しい実行で安定したベースラインを見つけるのに役立ちます。
サムネイル自体で視聴者を教育します。 clutterなしで「方法」や「ステップバイステップ」などの簡単なフレーズを使用して教育的価値を示します。データで効果を測定します。予測結果が次の手を導きます。クリック率、視聴時間、維持率などの主要な指標に焦点を当てます。トーン、構成を洗練するために結果を使用します。
- 動画ごとに3つのサムネイルバリエーションを定義します。ベースライン、コントラストブースト、テキスト強調。それぞれにメイン要素、2〜3語のラベル、3つのカラーアクセントのうち1つが含まれます。48時間のウィンドウでパフォーマンスを追跡します。ベースラインが平均よりも10%パフォーマンスが低い場合は、ブーストされたバリアントに切り替えます。
- 簡単なダッシュボードにデータを記録します。次のドロップの予測に焦点を当てます。将来のデザインに結果をフィードします。改善のサイクルを保証します。
- ピクトリアル表現を実験します。被写体の表情で感情を示します。さまざまなポーズ。ピクセル単位の忠実度を確保します。サムネイル全体でトーンの一貫性を維持します。
- テスト期間の範囲を設定します。48時間から開始します。結果が未確定の場合は72時間に延長します。直帰率や視聴完了率などの教育的指標を使用して効果を測定します。
- 強化: フォントサイズの変更を実装し、カラーパレットのバリエーションをテストし、さまざまなデバイスコンテキストでの可読性を確認します。小さなサムネイル全体での2〜3語のラベルの可読性を確保します。
サムネイルの解剖学: 注意を引くテキスト配置、表情、カラーコントラスト
推奨事項: 自然な視聴に合わせて左上の象限に簡潔な見出しを配置し、1080pスケールでの視覚性を確保するためにテキストを2〜4語に制限し、デバイス全体で高品質な可読性を確保します。
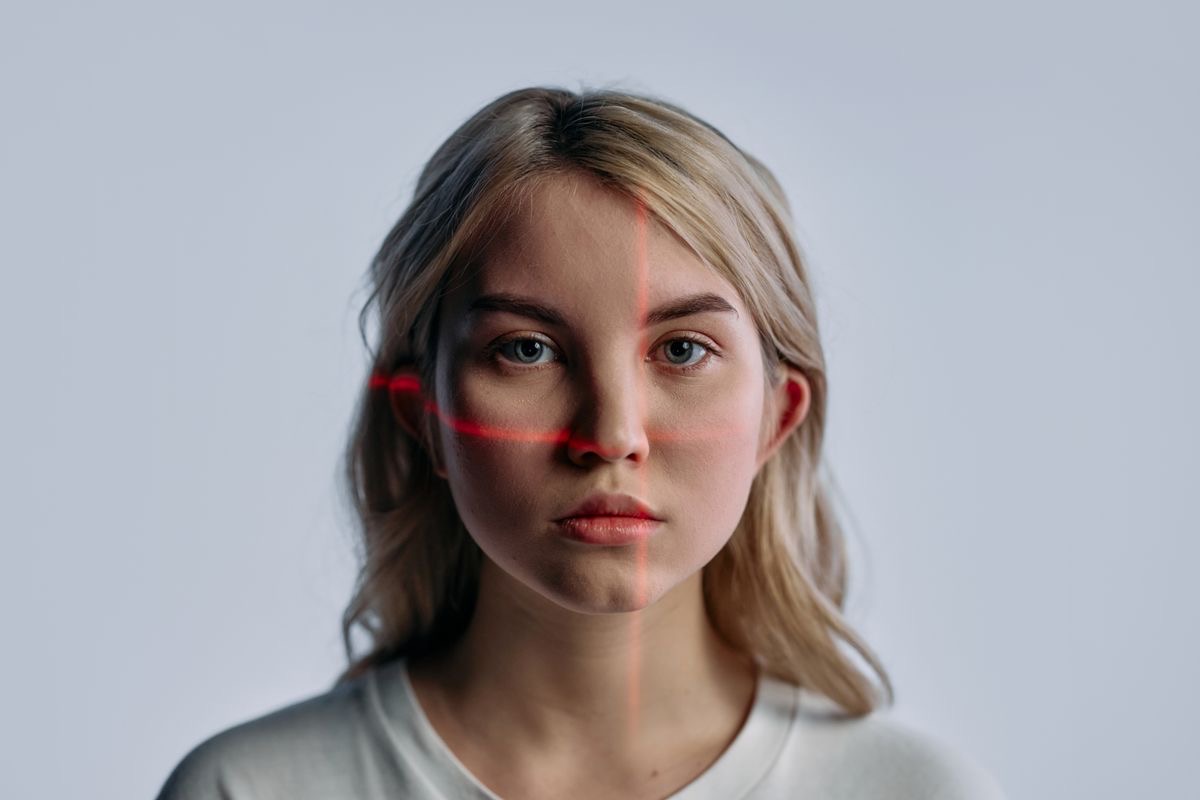
表情が重要です。フレームの約40〜60%を占めるクローズアップの顔は、明確に感情を伝えます。視線、かすかな笑顔、眉をひそめた表情は、 clutterなしで認識を導きます。これにより、推測が減り、信頼できるストーリーを提示することで信頼が高まります。
カラーコントラストの原則が視認性を推進します。見出しが控えめな背景に対して際立つ高コントラストのパレットを選択します。テキストのトーンと背景の間の不協和音を避け、小さなスケールでの可読性を維持します。fotorを含む信頼できるソースから事前にデザインされたパレットを使用して、クリエイティブ全体で一貫性を維持します。
構造が評価をサポートします。3層のフレームワークが発見、エンゲージメント、コンバージョンをカバーします。チームは検出を使用して、平均視聴時間、維持率、共有率などのメトリクスを追跡します。サンプルパレットからの結果は、視聴者の間で優れた信頼を示しています。このアプローチは、市場での全体的なパフォーマンスを変革するフレームワークを提供し、最適化を導くコア信号を強調します。
ヒント: 市場テスト全体で一貫性を保ちます。最も成功したカラーコンビネーションを強調します。チームはコピーの可読性を評価します。検出ツールは可読性を測定します。信頼を構築するためにパレット範囲を制御されたセット内に保ちます。事前に設計された構造はクリエイティブワークフローをサポートし、推測を減らします。
注: このフレームワークは明確なガイダンスを提供します。クリエイティブブリーフを持つチームは信頼を向上させます。検出はどのパレットが響くかを明らかにします。全体的な結果は、市場パフォーマンスを変革することを示しています。
CTRシグナルを解読する: 監視すべきメトリクスと対応方法
タイトなシグナルループから始めます。クリック率を相対的な指標として分離し、インプレッション、アクセス、配置品質に合わせます。各要因が数値的な差を生み出す単一のスコアリングモデルを構築します。
メトリクスを監視します。クリック率。インプレッション。平均視聴時間。冒頭の視聴者維持率。ミッドロールドロップ。配置共有。タイトルの有効性。視覚的な明瞭さ。レイアウトバランス。各側面を評価します。タイトルの明瞭さ、視覚的なインパクト、レイアウトの調和。より広範なデータセットを使用して、トピック、ジャンル、季節を横断するパターンを検出します。1週間のテスト後もゲインが持続することを確認します。
特定の配置のシグナルが改善したら、タイトルを洗練することによって対応します。レイアウトを調整します。ビジュアルタイルを微調整します。fotorの次世代デザインアセットに移行します。この変革的なステップは、より広範なオーシャンスへのアクセスを拡大します。チェックのためにローテーションセットのバリアントを使用します。要因の影響を分離するためにテストをタイトに保ちます。
スコアリングアプローチ: 各バリアントに複数要因スコアを割り当てます。タイトルの明瞭さ。視覚的な魅力。レイアウトバランス。配置の関連性。情報価値。明確なリードが現れた場合は、より広範な露出にエスカレートします。チェックを使用して信頼性を確認します。このアプローチは、チャンネル全体で価値を成長させるのに役立ちます。次のステップ: 別のテストサイクルを実行します。
チェックと落とし穴: 過度な主張を避けます。短いスパイクを誤読します。単一の勝利ではなく、継続的に成長するシグナルに依存します。エクスペリエンスが貴重であり続けることを保証するために、強力なアクセスレンズを使用します。
ワークフローブループリント: 日次チェック。週次レビュー。月次アーカイブ。結果を成長させるのに役立つライブダッシュボードを構築します。次世代属性を含む。より広範なオーシャンスを引き付ける、リードする、魅力的なエクスペリエンスを目指します。vloggingアウトリーチを変革して成功させます。
サムネイルのA/Bテストブループリント: セットアップ、メトリクス、決定ルール
最初の24時間以内のクリック率を測定するために、コントロールと2つの代替案を持つ3バリアントテストを実装します。すべて同じトピックに焦点を当てます。ドライバーを特定するために、バリアントごとに1〜2個の要素変更を分離する構造を使用します。ブランド認知度を維持するために、ロゴ、顔、ビジュアルを明確に読みやすく保ちます。バリアントあたり少なくとも50,000回のインプレッションまたは有意になるまで実行します。目標リフトは8〜12%、信頼度は95%、検出力は80%とします。具体的な仮説を立てることを推奨します。焦点面が調整されると、レイアウト調整はエンゲージメントを動かす可能性が高くなります。
テストの実装: 1つのバリアントあたり1つまたは2つの要素のみが異なることを保証するオールインワンワークフローを採用します。クロスエフェクトを回避するために組み合わせを制限します。さまざまなレイアウト(グリッド、クローズアップ付きシングルビジュアル、タイポグラフィ付きスプリット)をテストします。読みやすいタイポグラフィと一貫したカラーパレットを備えたモダンなビジュアルを使用します。低品質の要素から保護します。バリアントが生成カラー スキームを使用する場合は、可読性とブランドの一貫性を確認します。クリーンなA/Bまたは多変量アプローチを実行するかどうかは、事前に決定できます。
指標: 主要指標はクリック率。二次指標は開始率、視聴完了率、平均視聴時間、初期ウィンドウ内での完了率。サムネイルのプレビューパフォーマンスを、チューブサムネイルフィードの参照を調べることで実際のエンゲージメントにマッピングし、クロスデバイスレンダリングを追跡して一貫性を確保します。これらのデータポイントは、将来のテストに役立つシグナルをもたらします。
意思決定ルール: 事前に設定されたリフト値に統計的有意性 (p<0.05) をもって到達した場合、勝者を宣言します。信頼区間が重なる場合は、上限までインプレッションを追加して実行を延長するか、調整済みMDEで再推定します。あるバリアントが明らかにパフォーマンスが低い場合(例: クリック率がコントロールより3分の1以上悪い場合)、そのアームを中止し、予算を再配分します。
改善と再利用: チャンネルとの連携を維持し、チューブサムネイルフィードで一貫性を確認します。勝利したレイアウトを他の動画に適用し、テンプレートをオールインワンリポジトリに保存します。顔/ロゴ/ビジュアルを交換できるようにモジュラー構造を維持します。複数のバリアントからトップ要素を組み合わせて、将来のリリース用の新しいパックを作成します。量よりも明確さを優先して際立ちます。また、チーム全体で改善を維持して成長を加速させます。
モバイルクリエイター向けのPicsart AI機能: テンプレート、自動クロッピング、クイック編集
デザイン性の高いテンプレートライブラリから始め、ビジュアルスタイルに合ったパックを選んでください。これにより、推測作業が減り、制作がスピードアップし、一貫性が保たれます。reelmindaiの数千ものレイアウトを使用して、教育ビデオから製品デモまで、さまざまなテーマをカバーし、投稿全体でビジュアルの一貫性を保ちます。
自動クロッピングはAIを使用して被写体、顔、テキスト、主要なビジュアルをフレーミングします。構成線や、3分の1ルール交差点の近くの主要な被写体を特定し、モバイルディスプレイのセーフエリアを維持します。この機能により手動編集が減り、クリエイターは日々のリリースに追いつくことができます。
クイック編集には、カラーグレーディング、明るさ、コントラスト、フォントオーバーレイ、装飾テクスチャが含まれます。ブラスター風プリセットは、ドラマチックな効果のためにダイナミックな強度を高めます。鮮やか、落ち着いた、ネオン、パステルなどのパレットにより、瞬時にスタイルを変更できます。reelmindaiのデータ駆動型プリセットは、何百ものスタイルをキュレートします。キーワードは、トピックと視覚的に一致するビジュアルを見つけるのに役立ちます。結果はリアルタイムで表示され、最小限のストレージ影響で反復的な調整が可能になります。
教育的なヒントは、初心者向けにベストプラクティスをガイドします。インタラクティブなプレビューでは、投稿前に結果を確認できます。製品デザインは、スムーズなクリエイターエクスペリエンスを優先します。インターフェイスには、ガイド付きプロンプト、デザイン性の高いレイアウト、明確なスタイルオプションが用意されています。
ストレージフットプリントはモバイルでコンパクトに保たれます。重いアセットでは制限トリガーが表示される場合があるため、最適化されたビジュアルを備えたテンプレートを選択してください。全体的な製品は、カラーパレット、テクスチャ、レイアウトを含む何千ものテンプレートをサポートしています。クラウドストレージとの同期により、デバイスの制限を超えた追加の安全性が提供されます。
モバイルファーストデザインの具体例: フォントサイズ、セーフエリア、ロゴ配置
モバイルファーストのタイポグラフィスケールとセーフエリアの足場から始め、デバイス全体での可読性を保証します。本文の基本テキストを14~16px (0.875~1rem)、見出しを22~28pxに設定し、行間を1.4~1.6にします。カスタマイズ可能なスタイルシステムを実装して、すべての画面でビジュアルを高画質に保ち、基本的なコントラストチェックを実行して、視聴者が視聴中に明確に読めるようにします。ドリフトを避けるために、スケーラブルなシステムを1つだけ使用してください。
セーフエリアが重要です。コンテンツを env(safe-area-inset-*) 値を尊重するコンテナ内にラップし、重要な要素がノッチやホームインジケーターの下に表示されないようにします。主要なテキストとロゴを、各端から快適なマージン (8~16px) 内に配置します。これにより、視聴者の可読性が向上し、デザインのイノベーションがサポートされます。
ロゴ配置: モバイルでは高さ約20~28px、大きい画面では40~60pxにスケールし、上部領域に8~24pxのクリアゾーンを設けてマークを配置します。レイアウトに応じて左揃えまたは中央揃えにしますが、セーフエリアの端とロゴが衝突しないように、一貫したマージンを維持します。これにより、さまざまなレイアウトが維持されます。
初心者でも、320pxの幅と360x780の高さでドラフトをシミュレートして分析できます。自動修正スペーシングの提案とVidiqスタイルのプレビューを使用して、レイアウトが小画面でどのように表示されるかを確認します。詳細なチェックは、初心者でも熟練したクリエイターでも可読性を確保するのに役立ち、このアプローチはプロセスで時間を節約できます。
画像と構図: 強いコントラストを持つ高品質のビジュアルを維持します。太字のタイポグラフィで機能する、シンプルで一般受けするグラフィックを使用します。主要なテキストを覆い隠すオーバーレイを避け、主要な被写体をセーフエリア内に配置します。このアプローチは、市場の多くの企業に支持されており、明確さとモダンな美学を組み合わせて、さまざまなオーディエンスのクリエイターにとってエンゲージメントを高めます。オーディエンスがカジュアルな群衆であってもニッチ市場であっても、一貫性は重要です。
| 要素 | モバイルガイドライン | デスクトップ調整 |
|---|---|---|
| タイポグラフィ | 本文: 14-16px; 見出し: 22-28px; 行間: 1.4-1.6; remベースのサイジング | 本文: 16-18px; 見出し: 28-36px; 行間: 1.45-1.6; スケーラブルなタイポグラフィ |
| ロゴ | 高さ 20-28px; 8-16px のクリアスペース; 上揃え | 高さ 40-60px; 一貫したコントラスト; マージンを維持 |
| セーフエリア | env(safe-area-inset-*) によるパディングで端をクリアに保つ | より大きなキャンバスに同じ概念を適用; 端の切り抜きを避ける |
| 画像 & 構図 | 中央の被写体; 端の切り抜きを避ける; 320px 幅でテスト | より広い切り抜き; アスペクト比全体での可読性を確保 |
| チェック & テスト | 実機でプレビュー; 自動スペーシング修正; 群衆フィードバックで分析 | タブレットにテストを拡張; 複数の解像度で検証 |
回避すべき落とし穴: テキストの重なり、ストック画像、ブランドの一貫性
具体的な推奨事項: セーフテキストゾーン、単一のフォーカル画像、ブランドキューを備えた3部構成のサムネイルテンプレートを実装します。この簡単な構造は、構成を安定させ、ランキングシグナルを向上させ、重なりを制限し、電話ビュー全体での可読性を維持します。生成AIの進歩により、オリジナル作品の簡単な作成が可能になります。Midjourneyは実用的なプロンプトを提供します。
- テキストの重なりのリスク: 電話ビューでは、重要な画像の上にコピーが表示されます。これにより、表示可能性が低下します。解決策: コピーの後ろにクリアスペースを作成します。半透明のレイヤーを適用します。2〜3行に制限します。電話ではフォントサイズ14〜16px、大きい画面では18〜22pxにします。コントラスト比4.5:1を確保します。結果: スキャンしやすくなり、コンバージョンをサポートします。
- ストック画像の落とし穴: 一般的な雰囲気は、ブランドビジュアルと比較してランキングを低下させます。解決策: Midjourneyプロンプトに投資してオリジナル画像を作成します。モジュール全体にテンプレートを適用します。ブランド統合を使用します。ライセンスを確認します。複数のプラットフォームでテストします。分析によって測定された影響。改善を定量化するためにベースラインと比較します。ユニークなビジュアルで注意を引きます。
- ブランド一貫性の落とし穴: 一貫性のないカラーパレット、タイポグラフィ。解決策: 固定された構成ルールを持つマスターテンプレートを設計します。カラーヘックスコードを指定します。ロゴ配置を確保します。プラットフォーム全体で一貫したビジュアルを維持します。承認されたら、いくつかの動画に再利用します。レビュープロセスを実装します。分析駆動型メトリックは、視聴者ランキングへの影響を示します。統一されたデザインへの投資は、認識を容易にします。